Heatmaps: See How Viewers Really Interact With Your Video Content
When you watch a video, you think you know what’s happening—people are watching, pausing, maybe skipping. But heatmaps, visual representations of user interaction data that show where attention is focused on a screen. Also known as click heatmaps or view heatmaps, they reveal what actually happens when your video plays—far beyond what analytics numbers can tell you. Most creators assume viewers watch from start to finish. Heatmaps prove that wrong. They show you exactly where people drop off, which buttons they click, and even which parts they rewatch. This isn’t guesswork. It’s real behavior, mapped out frame by frame.
Heatmaps don’t just track clicks—they track eye movement, scroll depth, and pause points. If you’re making tutorials, product demos, or social clips, you need to know if your call-to-action is being ignored, or if viewers are stuck on a confusing transition. A video heatmap, a type of heatmap specifically designed to visualize viewer behavior within a video player tells you if your intro is too long, if your product shot is getting skipped, or if your ending is being watched. It’s not magic. It’s data. And it’s the only way to fix what’s broken in your content before you waste more time and money on the same mistakes.
Think about it: you spend hours editing a video, tweaking music, adding text, and still get low retention. Why? Because you’re working blind. Heatmaps give you a map of your viewer’s journey. They show you the hot zones—the parts people love—and the cold zones—the parts they flee from. You can then cut the fluff, reposition your key message, or adjust timing based on real behavior, not assumptions. This isn’t just for big studios. Even solo creators using tools like Wistia, Vidyard, or YouTube’s own analytics can access basic heatmaps. You don’t need a team. You just need to look at the data.
What you’ll find in these posts are real examples of how heatmaps changed everything—from fixing awkward transitions in TikTok edits to boosting sign-ups on explainer videos. You’ll see how marketers used click heatmaps to redesign their video thumbnails, how educators improved course retention by moving key points to high-engagement zones, and how e-commerce brands cut their video production time by 40% just by trimming what no one watched. This isn’t theory. It’s what’s working right now. And if you’re not using heatmaps, you’re editing in the dark.
20
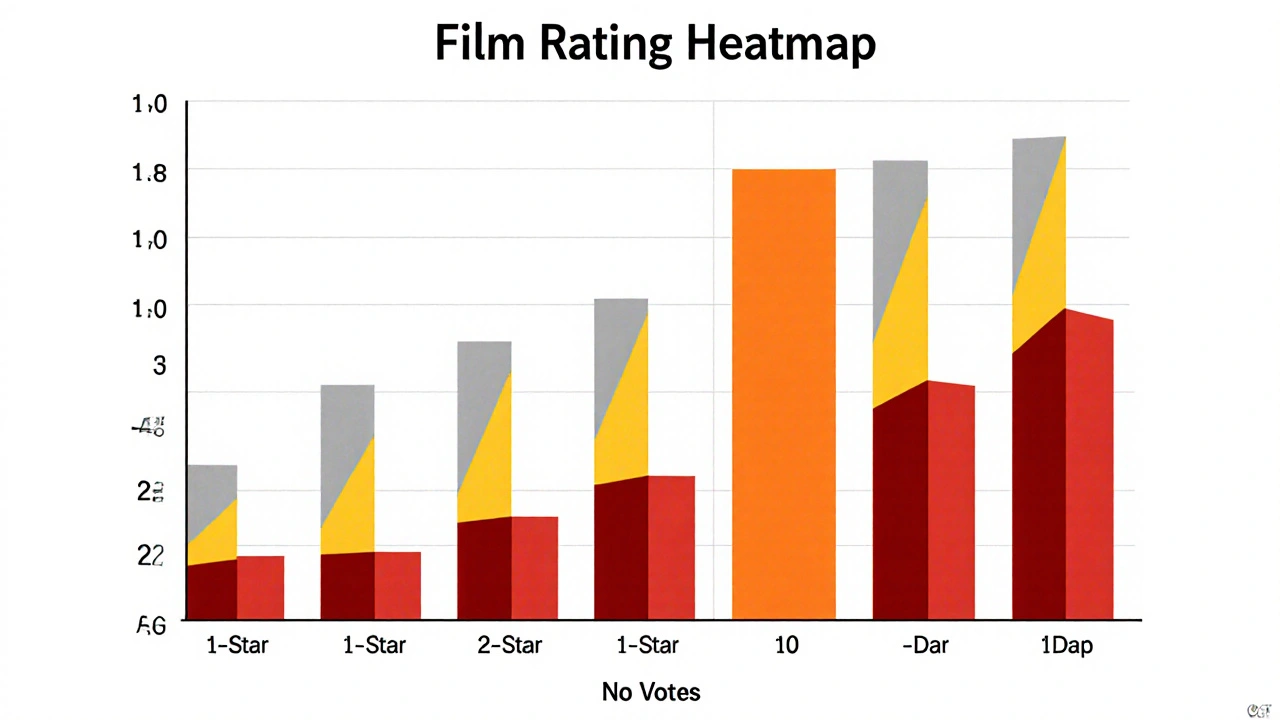
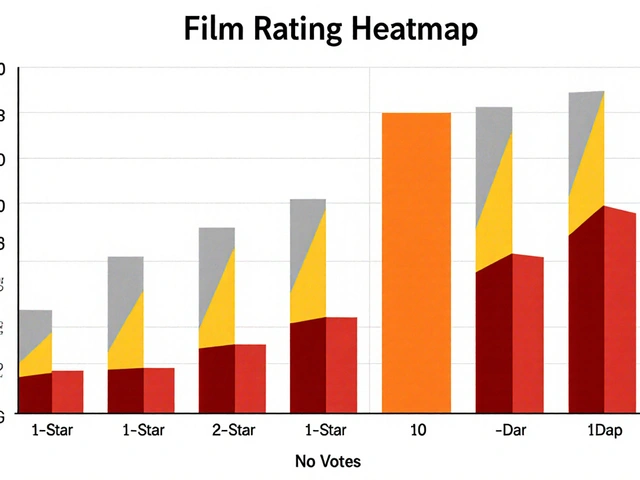
Visualizing Ratings: Heatmaps, Distributions, and Outlier Films
Learn how to read beyond movie ratings by using heatmaps, distributions, and outlier analysis to understand why films divide audiences - and what that really means for what you should watch next.
Latest Posts
Popular Posts
-
 YouTube TV vs. Hulu + Live TV: Comprehensive Family Streaming Comparison
-
 Adventure Pulp on Screen: Analyzing The Mummy, The Rocketeer, and Serial DNA
-
 Paramount+ 4K Devices: Best TVs and Streamers for Ultra HD
-
 Wireless vs. Wired Streaming Connections: Which One Should You Use?
-
 How to Secure Your Netflix Account: 2FA and Login Alerts Guide